A Histogram map is one that serves a a geographical representation of the distribution of data. It analyzes and displays the probability distribution of a continuous variable. http://procomun.wordpress.com/2012/02/20/maps_with_r_2/
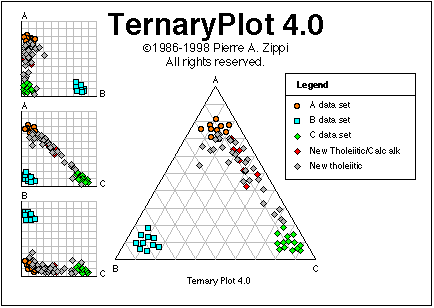
Triangular plot maps is a barycentric plot on three different variables which sum up to a constant. This type of map usually represents the ratios of the three different variables as positions in an equilateral triangle. http://www.pazsoftware.com/Ternary5.html
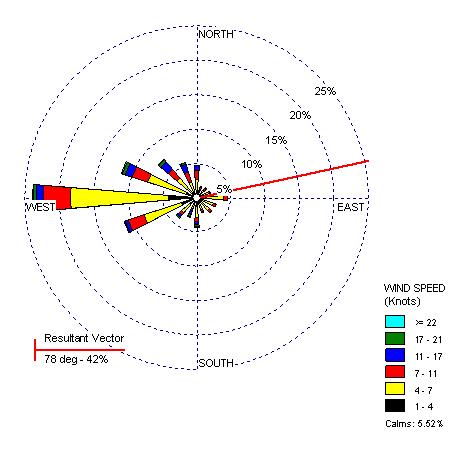
A wind rose map give an off-putting view on how windspeed and direction are typically distributed in a particular region. These sorts of maps are represented in a circular format to show which direction the wind in blowing in. The maps are made of different circles that represent different wind patter factors.
A Climograph map is one that shows a graphical representation of basic climatic parameters at a certain location. This type of map can be used for a quick glance at the type of climate conditions of an area.
A scatterplot map is a map that uses dots to represents certain data. It is a graph of plotted points that show a relationship between two sets of data. The dots are plotted off of an x and y axis and places in open space within the graphing area. These are similar to bivariate maps.