Thursday, April 17, 2014

Vector Map


A vector map consists of a data layer made up of a number of sparse features in geographic space that is usually represented though a geographical information system. 

http://www.webresourcesdepot.com/all-free-vector-world-maps-ai-eps-svg/

Raster Map


A raster map is made up of dot matrices that are structured together to represent a rectangular grid of pixels through points of color. This are also put together gridded arrays of cells to make one larger, more clear image.

http://www.grassbook.org/gallery/ch3getstarted/images.html

Star plots


Star plots are radar charts that is a graphical method of displaying multivariate data in the form of a 2D chart where many quantitative variables are represented on axes starting from the same point.

http://aapgbull.geoscienceworld.org/content/84/7/1041.abstract

Correlation matrix


A correlation matrix map displays the correlation between variables. It represents the broad class of statistical relationships involving dependence.

http://www.emeraldinsight.com/journals.htm?articleid=1515237

Similarity matrix


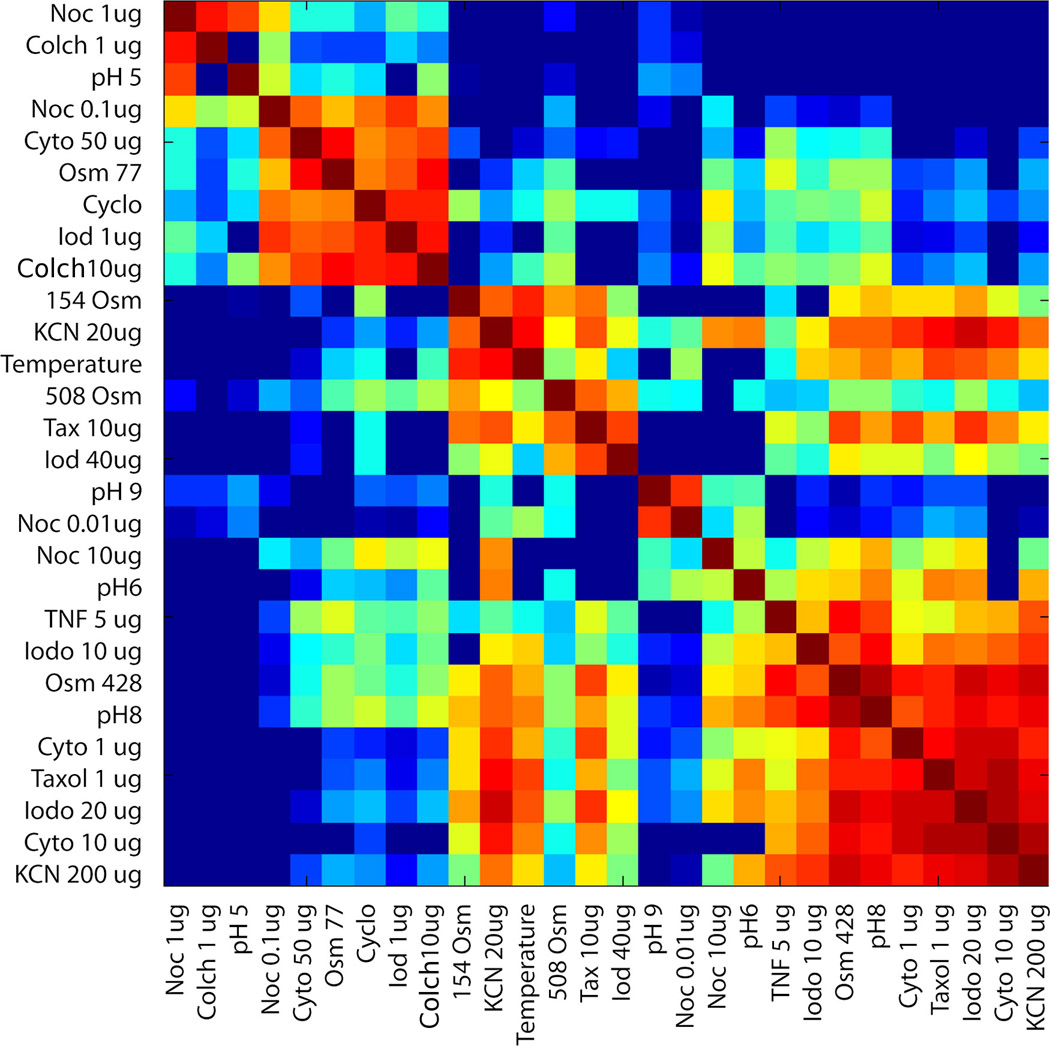
A Similarity matrix is a matrix of scores that represent the similarity between different sets of data points. Each aspect of the matrix contains a similarity and these are strongly related to their counterparts on the maps. 

http://spie.org/x48704.xml?pf=true&ArticleID=x48704

Stem and leaf plot


Stem and leaf plots is a method of the commonality of a number where certain class values that  frequently occur.

http://www.shmoop.com/basic-statistics-probability/stem-leaf-plots.html

Box plot Map


Box plot is a easy way to graphically depict groups or numerical data through their quantities. Box plots have lines extending vertically from the boxes that indicate at the variability that is being measured. 

http://nelsontouchconsulting.wordpress.com/2011/01/07/behold-the-box-plot/