Hi there! This is my Map Catalog for all the maps I'm going to collect over the semester for my GIS3015 class. I hope you enjoy them!
Thursday, April 17, 2014
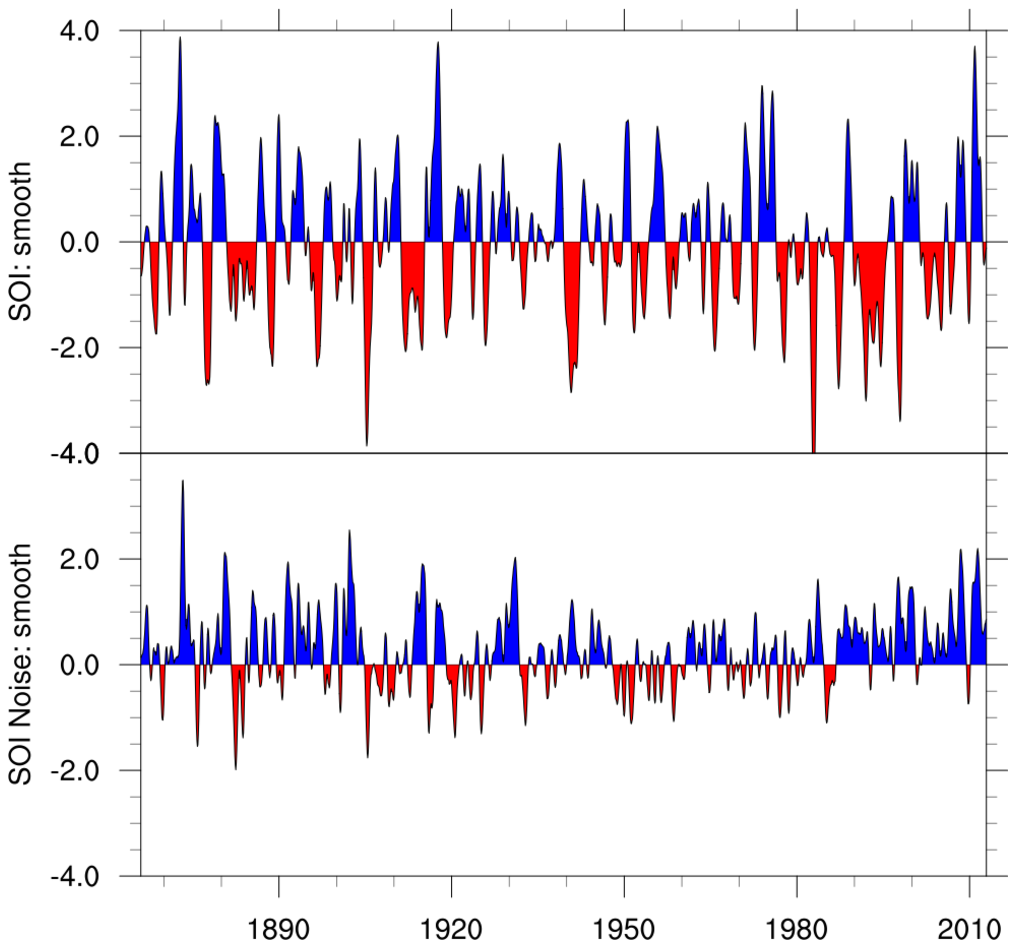
Index value plot
A index value plot is a type of map that is a visualization map in which an index value is plotted on a line graph. This is used instead of an absolute value. These types of maps give caparison to to order the base of values off of.
No comments:
Post a Comment